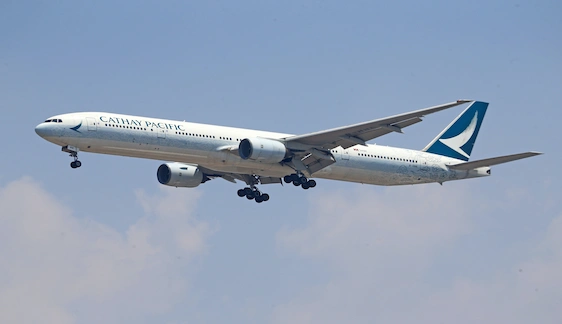
Today Cathay Pacific’s new award chart is live. This means that all award flights you book with Asia miles will use this new pricing. This award chart was only for flights operated by Cathay Pacific but now that the change is live, we can see how much partner award redemptions were affected. Let’s get into how bad these changes really were.
Partner Award Chart
Big shoutout to jaytw who created this unofficial award chart highlighting the pricing changes and costs for partner awards booked through Asia Miles.


As you can see, almost all distance zones saw an increase in price on partner airlines. The ultra short haul (0-750 mile) zone didn’t see an increase in price but also didn’t get a decrease, which is unfortunate since a decrease would have been one positive thing from this change.
Zone Distance Breakdown
0-750 Miles
There were 0 changes in this category. All partner redemptions are still priced the same as they were before.
Some example routes:
- London (LHR) to Zurich (ZRH)
- Sydney (SYD) to Melbourne (MEL)

751-2750 Miles
This zone actually has a type 1 and type 2 based off of the Cathay Pacific specific award chart. It’s harder to categorize which routes fall into which type since these routes involve partner airlines but I haven’t seen too much difference in price. It seems to be either 32,000, 33,000, or 37,000 Asia Miles for business class.
This distance zone got hit the hardest out of the all the zones with a price increase starting at 17% and going up to 33%!
Some example routes:
- Kuala Lumpur (KUL) to Perth (PER)
- Istanbul (IST) to Doha (DOH)
- Tokyo (HND) to Taipei (TSA)
- Doha (DOH) to Mumbai (BOM)


2751-5000 Miles
This zone also saw some pretty nasty changes with business class increasing by 26% and first class increasing by 33%.
Example Routes:
- London (LHR) to Mumbai (BOM)
- Doha (DOH) to Hong Kong (HKG)
- Tokyo (NRT) to Sydney (SYD)
- Helsinki (HEL) to Delhi (DEL)
5001-7500 Miles
This is the main category readers probably care about since it involves the US. Surprisingly, this zone wasn’t hit too badly with increases. Going from 75k to 89k for business and 120k to 135k for first class sucks but I thought that it would be worse.
If there’s a transfer bonus it would definitely help make these awards more affordable.
Example Routes:
- New York (JFK) to Tokyo (HND)
- Los Angeles (LAX) to Sydney (SYD)
- San Francisco (SFO) to London (LHR)


7501+ Miles
This zone probably won’t apply to most people since these are super long flights and doesn’t include many “popular” routes. However, it does include some of the longest flights in the world which is pretty cool.
Example Routes:
- Auckland (AKL) to Doha (DOH)
- Los Angeles (LAX) to Doha (DOH)


Conclusion
Devaluations always suck, there’s no way around that but the silver lining is that this devaluation could’ve been way worse. Being able to fly from the US to Asia in F for 135k is still a pretty great deal so I’m not too bummed out with this change. What are your thoughts on the new award chart?

